I wanted to expand my knowledge beyond HTML, CSS, and Javascript, so I began to learn React, a popular Javascript library developed by Meta and community. It has an heavy emphasis on user interface and using components to build applications. This project is also a part of another class that I'm currently taking in which me and my classmates are building this comprehensive site, so I figured it would be much more manageable than creating another React app from scratch.
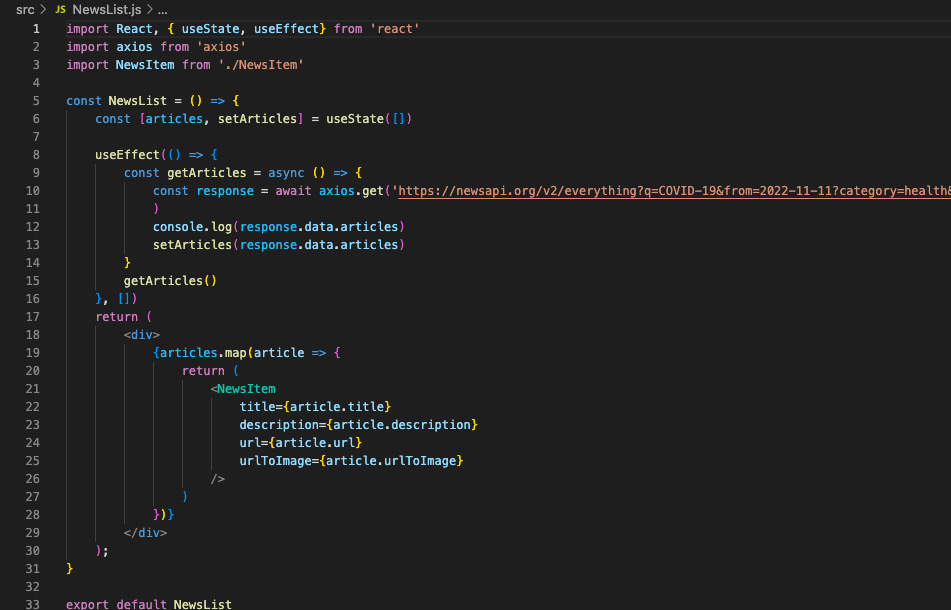
Here we have a portion of code from the newsfeed portion of the site. I used a axios, a library that makes HTTP requests in combination with a news API to create news "cards" to display articles in an easy-to-read, digestible format. It uses several parameters such as keywords, category, and source to pull articles from news outlets.
Some struggles that I had with this portion of the site was getting the most relevant articles. Initially, a lot of the articles that were being pulled were not very scientific. For example, there were a few articles about certain public figures getting COVID, which isn't really relevant to the purpose of the website. I mitigated this issue by adding stricter parameters (although an article similar to the ones mentioned above may still leak through).
Initially, I wanted to display the newsfeed as a carousel where users can cycle through articles. This initial thought was assured by peers and the professor. However, I spoke with another professor who is well acquainted with React applications who told me that carousels are generally not a good idea and a component that is rarely used in the React framework.
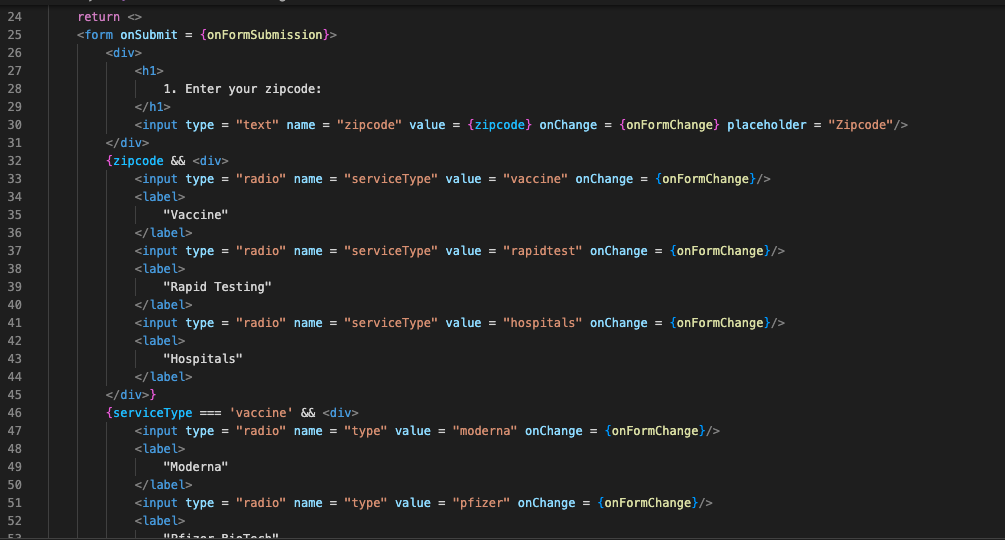
This is an portion of the questionaire portion of the site. Its purpose is to allow users to choose what kind of COVID-19 related services they want and displays the nearest location that provides that service. One of the initial issues with this issue was the routing element of it. We had to make a big "tree" with different branches depending on user choice.

This is a very small portion of the code for the map with test centers. It explains the markers and their functionality. The map shows locations from government sponsored testing sites.
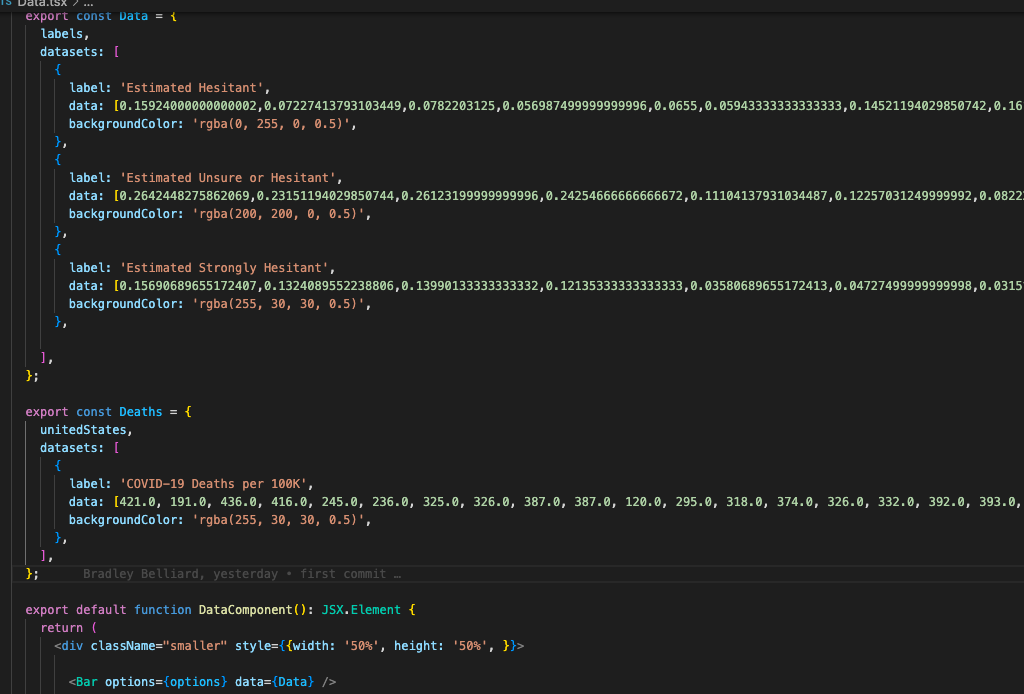
In order to create data visualizations. I used Chart.js, a library specifically for this purpose. I want to include two charts; one regarding vaccine hesitancy across states and another displaying COVID-19 deaths adjusted for population. The point is to make observations between these statistics and connect the two together and give reason as to why there may be more/less COVID-19 deaths in some places compared to other.
The main issue that I encountered was that the chart for COVID-19 deaths adjusted for population was empty. However, I was able to remedy this by building the charts from a clean slate.